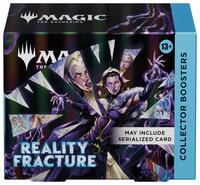
Sales and supply · Reality Fracture
Reality Fracture Collector Booster Display
Released Oct 2, 2026
At a glance
The 14-day TCGplayer market price is $482.57, based on 1,178 units sold. That is 12.6% below the preceding 14 days, which included 766 units.
TCGplayer recorded 694 units sold in the last seven complete days, compared with 484 in the preceding seven.
The latest supply snapshot shows 280 visible units from 79 sellers, a change of +139 units and +44 sellers over 7 days.
- 14-day market price
- $482.57 Based on 1,178 units sold
- Price change
- -12.6% 1,178 recent · 766 prior units
- Units sold
- 1,178 1,023 transactions
- Visible supply
- 280 79 sellers · Oct 8, 2026
Latest TCGplayer sale: Oct 9, 2026, 5:32 AM EDT · TCGplayer supply: Oct 8, 2026 · Mana Pool: Oct 9, 2026, 8:16 AM EDT
01
Marketplace observations
Each marketplace is reported on its own stored price basis. These figures are not a cross-marketplace price comparison.
TCGplayer
Oct 8, 2026- Lowest listing price
- $433.99 Stored item price
- Median asking price
- $499.82 Quantity-weighted item ask
- Visible units
- 280 Last observation in daily aggregate
- Sellers
- 79 Last observation in daily aggregate
- Daily quantity range
- 280–314 Average 294.7
- Latest item sale
- $443.98 Oct 9, 2026, 5:32 AM EDT
Mana Pool
Oct 9, 2026, 8:16 AM EDT- Lowest listed price
- $425.00
- Market price
- $474.49 Mana Pool field
- Available quantity
- 90
02
Price and supply history
Daily weighted-average item prices, stored asking prices, visible units, and seller counts remain separate series.
Prices
- Daily weighted-average item price
- $443.12
- TCG lowest ask
- —
- TCG median ask
- —
- Mana Pool market
- $474.49
Supply
- Units sold
- 22
- Visible units
- —
- Sellers
- —
View chart data as a table
| Date | TCG daily weighted-average item price | TCG low ask | TCG median ask | Mana Pool market | Units sold | Visible units | Sellers |
|---|---|---|---|---|---|---|---|
| 2026-10-09 | $443.12 | — | — | $474.49 | 22 | — | — |
| 2026-10-08 | $431.38 | $433.99 | $499.82 | $474.95 | 65 | 280 | 79 |
| 2026-10-07 | $435.36 | $430.00 | $477.95 | $474.99 | 81 | 316 | 85 |
| 2026-10-06 | $449.40 | $439.00 | $499.82 | $475.00 | 98 | 262 | 79 |
| 2026-10-05 | $452.35 | $446.90 | $519.99 | $475.00 | 69 | 263 | 73 |
| 2026-10-04 | $472.33 | $465.00 | $517.00 | $475.00 | 72 | 265 | 71 |
| 2026-10-03 | $461.44 | $460.00 | $519.99 | $482.28 | 120 | 220 | 51 |
| 2026-10-02 | $461.58 | $455.00 | $519.99 | $482.28 | 193 | 221 | 58 |
| 2026-10-01 | $490.44 | $474.00 | $519.99 | $519.99 | 99 | 141 | 35 |
| 2026-09-30 | $502.51 | $485.00 | $519.99 | $539.45 | 73 | 178 | 34 |
| 2026-09-29 | $533.37 | $517.00 | $536.01 | $549.98 | 49 | 187 | 31 |
| 2026-09-28 | $553.50 | $551.09 | $558.75 | $539.49 | 60 | 107 | 19 |
| 2026-09-27 | $553.71 | $552.70 | $574.38 | $534.99 | 63 | 97 | 19 |
| 2026-09-26 | $565.29 | $547.00 | $574.47 | $529.99 | 61 | 112 | 22 |
| 2026-09-25 | $571.52 | $568.95 | $574.47 | $524.91 | 72 | 128 | 22 |
| 2026-09-24 | $575.48 | $560.00 | $588.92 | $524.91 | 47 | 109 | 25 |
| 2026-09-23 | $586.89 | $584.98 | $588.92 | $524.92 | 33 | 102 | 20 |
| 2026-09-22 | $588.10 | $586.04 | $593.70 | $524.91 | 35 | 96 | 17 |
| 2026-09-21 | $589.99 | $585.66 | $593.70 | $524.91 | 29 | 105 | 20 |
| 2026-09-20 | $566.49 | $599.60 | $615.99 | $524.91 | 51 | 87 | 14 |
| 2026-09-19 | $548.86 | $548.84 | $599.95 | $523.23 | 83 | 97 | 12 |
| 2026-09-18 | $549.28 | $548.84 | $548.84 | $522.22 | 76 | 162 | 13 |
| 2026-09-17 | $549.11 | $546.85 | $549.61 | $519.91 | 81 | 209 | 13 |
| 2026-09-16 | $550.46 | $549.62 | $549.62 | $519.99 | 60 | 162 | 8 |
| 2026-09-15 | $549.65 | $549.60 | $549.66 | $519.96 | 54 | 187 | 9 |
| 2026-09-14 | $550.28 | $549.67 | $549.71 | $519.92 | 43 | 200 | 10 |
| 2026-09-13 | $532.81 | $549.75 | $549.99 | $519.00 | 59 | 202 | 7 |
| 2026-09-12 | $529.39 | $529.99 | $599.99 | $515.00 | 56 | 245 | 12 |
| 2026-09-11 | $532.21 | $530.29 | $599.99 | $510.98 | 62 | 207 | 10 |
| 2026-09-10 | $529.84 | $530.33 | $530.38 | $519.99 | 86 | 224 | 10 |
| 2026-09-09 | $529.44 | — | — | $520.00 | 141 | — | — |
| 2026-09-08 | $525.41 | $523.63 | $530.39 | $522.99 | 116 | 103 | 13 |
| 2026-09-07 | $530.40 | $530.40 | $530.41 | $524.96 | 13 | 93 | 13 |
| 2026-09-06 | $530.41 | $530.41 | $530.43 | $524.96 | 14 | 98 | 13 |
| 2026-09-05 | $536.30 | $530.43 | $530.45 | $524.96 | 10 | 110 | 13 |
| 2026-09-04 | $530.41 | $530.36 | $530.45 | $524.96 | 9 | 123 | 17 |
| 2026-09-03 | $530.45 | $530.43 | $530.45 | $524.96 | 12 | 122 | 15 |
| 2026-09-02 | $530.53 | $530.48 | $530.54 | $524.97 | 10 | 137 | 17 |
| 2026-09-01 | $534.26 | $530.58 | $530.62 | $524.97 | 8 | 111 | 15 |
| 2026-08-31 | $530.69 | $530.50 | $530.67 | $524.97 | 4 | 110 | 15 |
| 2026-08-30 | $532.75 | $532.61 | $533.67 | $524.97 | 11 | 113 | 14 |
| 2026-08-29 | $532.97 | $532.87 | $533.67 | $524.97 | 11 | 114 | 14 |
| 2026-08-28 | $533.27 | $533.67 | $533.67 | $529.98 | 8 | 94 | 12 |
| 2026-08-27 | $533.83 | $533.76 | $533.82 | $529.98 | 18 | 91 | 11 |
| 2026-08-26 | $533.79 | $533.78 | $533.82 | $524.00 | 9 | 98 | 11 |
| 2026-08-25 | $533.84 | — | — | — | 7 | — | — |
| 2026-08-24 | $533.87 | $533.90 | $533.93 | $524.00 | 10 | 28 | 8 |
| 2026-08-23 | $527.93 | $533.90 | $533.93 | $524.00 | 7 | 33 | 8 |
| 2026-08-22 | $508.01 | $519.96 | $594.00 | $524.00 | 11 | 20 | 7 |
| 2026-08-21 | $473.70 | $473.42 | $534.93 | $524.00 | 20 | 32 | 10 |
| 2026-08-20 | $473.41 | $473.39 | $475.50 | $524.00 | 9 | 45 | 12 |
| 2026-08-19 | $474.09 | $473.40 | $473.44 | $0.00 | 9 | 60 | 14 |
| 2026-08-18 | $473.92 | $473.44 | $475.17 | $0.00 | 13 | 66 | 13 |
| 2026-08-17 | $474.07 | $474.01 | $475.42 | $0.00 | 11 | 54 | 13 |
| 2026-08-16 | $476.76 | $474.08 | $475.42 | $0.00 | 23 | 53 | 13 |
| 2026-08-15 | $474.11 | $474.11 | $475.42 | $0.00 | 18 | 59 | 13 |
| 2026-08-14 | $474.12 | $474.12 | $475.42 | — | 15 | 79 | 17 |
| 2026-08-13 | $474.12 | $474.11 | $475.17 | — | 11 | 91 | 18 |
| 2026-08-12 | $474.28 | $474.12 | $475.17 | — | 8 | 99 | 18 |
| 2026-08-11 | $466.71 | $459.29 | $475.17 | — | 2 | 105 | 19 |
| 2026-08-10 | $474.18 | $459.29 | $474.44 | — | 18 | 107 | 18 |
| 2026-08-09 | $474.21 | $459.29 | $474.44 | — | 6 | 120 | 20 |
| 2026-08-08 | $474.23 | $459.29 | $474.28 | — | 8 | 127 | 21 |
| 2026-08-07 | $471.78 | $459.29 | $474.32 | — | 6 | 134 | 22 |
| 2026-08-06 | $474.34 | $474.32 | $474.39 | — | 7 | 139 | 21 |
| 2026-08-05 | $474.48 | $474.37 | $474.46 | — | 9 | 147 | 22 |
| 2026-08-04 | $474.66 | $474.55 | $474.62 | — | 7 | 150 | 21 |
| 2026-08-03 | $474.69 | $474.68 | $474.84 | — | 4 | 155 | 21 |
| 2026-08-02 | $474.78 | $474.73 | $474.88 | — | 4 | 166 | 22 |
| 2026-08-01 | $474.90 | $474.88 | $474.96 | — | 3 | 163 | 21 |
| 2026-07-31 | $474.95 | $474.92 | $474.96 | — | 6 | 166 | 21 |
| 2026-07-30 | $475.14 | $475.04 | $475.12 | — | 4 | 172 | 21 |
| 2026-07-29 | $475.17 | $475.15 | $475.31 | — | 3 | 173 | 21 |
| 2026-07-28 | $475.27 | $475.30 | $475.32 | — | 3 | 164 | 21 |
| 2026-07-27 | — | $475.39 | $475.40 | — | 0 | 164 | 21 |
| 2026-07-26 | $475.52 | $475.47 | $476.00 | — | 6 | 155 | 20 |
| 2026-07-25 | $475.81 | $475.62 | $476.00 | — | 2 | 159 | 20 |
| 2026-07-24 | $476.03 | $475.82 | $476.00 | — | 7 | 161 | 20 |
| 2026-07-23 | $476.21 | $476.13 | $476.26 | — | 11 | 142 | 19 |
| 2026-07-22 | $476.46 | $476.41 | $476.50 | — | 7 | 144 | 17 |
| 2026-07-21 | $476.71 | $476.66 | $476.72 | — | 8 | 147 | 17 |
| 2026-07-20 | $476.88 | $476.80 | $476.89 | — | 11 | 157 | 18 |
| 2026-07-19 | $480.91 | $476.98 | $477.20 | — | 11 | 130 | 17 |
| 2026-07-18 | $477.10 | $477.00 | $477.24 | — | 20 | 140 | 19 |
| 2026-07-17 | $477.21 | $477.19 | $477.25 | — | 25 | 148 | 18 |
| 2026-07-16 | $477.36 | $477.30 | $477.39 | — | 6 | 151 | 16 |
| 2026-07-15 | $477.46 | $477.39 | $477.57 | — | 4 | 155 | 16 |
| 2026-07-14 | $477.50 | $477.50 | $477.58 | — | 4 | 159 | 16 |
| 2026-07-13 | $477.60 | $477.59 | $477.61 | — | 3 | 160 | 16 |
| 2026-07-12 | $477.62 | $477.61 | $477.82 | — | 4 | 165 | 16 |
03
Sales activity
Complete TCGplayer sales windows, reported as recorded item prices and exact counts.
| Window | Dates | Units | Transactions | Lowest item price | Highest item price |
|---|---|---|---|---|---|
| 7 days | Oct 2, 2026–Oct 8, 2026 | 694 | 612 | $286.82 | $492.89 |
| 14 days | Sep 25, 2026–Oct 8, 2026 | 1,178 | 1,023 | $286.82 | $645.64 |
| 30 days | Sep 9, 2026–Oct 8, 2026 | 2,137 | 1,852 | $286.82 | $645.64 |
| 60 days | Aug 10, 2026–Oct 8, 2026 | 2,628 | 2,242 | $286.82 | $645.64 |
| 90 days | Jul 11, 2026–Oct 8, 2026 | 2,833 | 2,404 | $286.82 | $645.64 |
04
Supply evidence
Stored daily observations and exact changes between available snapshot dates.
Latest daily snapshot
- Date
- Oct 8, 2026
- First observed quantity
- 314
- Last observed quantity
- 280
- Minimum / maximum
- 280 / 314
- Average quantity
- 294.7
- First / last sellers
- 82 / 79
- Average sellers
- 80
Observed changes
| Comparison | Visible units | Sellers | Lowest item price |
|---|---|---|---|
| 7 daysOct 1, 2026–Oct 8, 2026 | +139 | +44 | -40 (-8.4%) |
| 30 daysSep 8, 2026–Oct 8, 2026 | +177 | +66 | -89.6 (-17.1%) |
How inventory is moving
Recorded TCGplayer sales and visible-supply changes between the stored UTC snapshot dates.
| Period | Units sold | Inferred additions | Visible-unit change |
|---|---|---|---|
| 7 daysOct 1, 2026–Oct 8, 2026 | 698 | 837 | +139 |
| 30 daysSep 8, 2026–Oct 8, 2026 | 2,171 | 2,348 | +177 |
Stored price distribution
Largest visible sellers
| Seller | Units | Share | Lowest item price |
|---|---|---|---|
| Authority Games | 32 | 11.4% | $469.99 |
| TheHiveHQ | 24 | 8.6% | $445.25 |
| Devastation | 14 | 5.0% | $550.00 |
| QDD TCGs | 12 | 4.3% | $456.00 |
| Card Rush | 10 | 3.6% | $456.85 |
| Sleever Hive | 10 | 3.6% | $506.84 |
| U Wine Bar | 10 | 3.6% | $642.60 |
| Journeys End Games | 8 | 2.9% | $641.49 |
| Collectors R' Us TCG | 6 | 2.1% | $477.95 |
| Fivestore | 6 | 2.1% | $499.82 |
05
Recent transactions
Exact stored transaction fields. Item price, shipping, and quantity are kept separate.
| Date | Marketplace | Item price | Shipping | Quantity | Condition | Variant | Language |
|---|---|---|---|---|---|---|---|
| Oct 9, 2026, 7:29 AM EDT | Mana Pool | $425.00 | $0.00 | 1 | — | — | — |
| Oct 9, 2026, 5:32 AM EDT | TCGplayer | $443.98 | $0.00 | 1 | Unopened | Normal | English |
| Oct 9, 2026, 4:35 AM EDT | TCGplayer | $456.85 | $0.00 | 1 | Unopened | Normal | English |
| Oct 9, 2026, 3:00 AM EDT | TCGplayer | $443.97 | $0.00 | 1 | Unopened | Normal | English |
| Oct 9, 2026, 2:27 AM EDT | TCGplayer | $443.97 | $0.00 | 1 | Unopened | Normal | English |
| Oct 9, 2026, 2:14 AM EDT | TCGplayer | $443.95 | $0.01 | 1 | Unopened | Normal | English |
| Oct 9, 2026, 1:37 AM EDT | TCGplayer | $420.00 | $2.00 | 1 | Unopened | Normal | English |
| Oct 8, 2026, 11:33 PM EDT | TCGplayer | $443.95 | $0.00 | 1 | Unopened | Normal | English |
| Oct 8, 2026, 11:26 PM EDT | TCGplayer | $443.95 | $0.01 | 1 | Unopened | Normal | English |
| Oct 8, 2026, 11:25 PM EDT | TCGplayer | $443.95 | $0.01 | 1 | Unopened | Normal | English |
| Oct 8, 2026, 11:19 PM EDT | TCGplayer | $443.95 | $0.01 | 1 | Unopened | Normal | English |
| Oct 8, 2026, 11:07 PM EDT | TCGplayer | $443.49 | $0.00 | 1 | Unopened | Normal | English |
| Oct 8, 2026, 10:46 PM EDT | TCGplayer | $445.25 | $2.00 | 1 | Unopened | Normal | English |
| Oct 8, 2026, 10:05 PM EDT | TCGplayer | $443.95 | $0.01 | 1 | Unopened | Normal | English |
| Oct 8, 2026, 9:54 PM EDT | TCGplayer | $443.95 | $0.01 | 1 | Unopened | Normal | English |
| Oct 8, 2026, 9:45 PM EDT | Mana Pool | $435.00 | $0.00 | 1 | — | — | — |
| Oct 8, 2026, 9:26 PM EDT | TCGplayer | $443.98 | $0.00 | 1 | Unopened | Normal | English |
| Oct 8, 2026, 9:20 PM EDT | TCGplayer | $443.97 | $0.00 | 1 | Unopened | Normal | English |
| Oct 8, 2026, 8:52 PM EDT | TCGplayer | $443.98 | $29.99 | 1 | Unopened | Normal | English |
| Oct 8, 2026, 8:38 PM EDT | TCGplayer | $435.69 | $14.99 | 1 | Unopened | Normal | English |
Methodology and data limits
TCGplayer sales. MTGsold’s 14-day market price uses TCGplayer item prices, weighted by quantity sold, after removing the highest and lowest 10% of units. It excludes the current partial day and shipping. The change compares it with the previous 14 complete days. The history chart groups those recorded item prices by UTC date and shows their quantity-weighted daily average.
Transaction rows. purchase_price, shipping_price, and quantity are displayed separately exactly as stored. This page does not allocate shipping or derive an order total.
TCGplayer supply. Each tcg_snapshots row summarizes the day’s supply scrapes. “First” and “last” refer to the first and last observations included in that daily aggregate. The stored date is shown without inventing an exact scrape time.
Inventory flow. For each displayed interval, sales are grouped by UTC date to match tcg_snapshots.scrape_date. Inferred additions to visible supply equal max(0, units sold + visible-unit change). This residual can include relistings and other listing changes, so it is not treated as a count of new seller listings.
Mana Pool. Low price, market price, and available quantity are Mana Pool fields from the timestamp shown. Shipping is not supplied in these observations, so no direct marketplace price comparison is made.
Date keys. TCGplayer sales windows use Eastern calendar dates. TCGplayer supply uses the stored UTC scrape_date.